Drag and drop fields to quickly retrieve data for analysis without the need of creating a report. Ad Hoc Reporting offers features such as:
- Convenient drag and drop functionality to create “reports”
- Grouping and sorting functionality
- Filtering capabilities
- Export to Excel functionality
Security, as configured in the Administration screens, is inherited ensuring users see only the data you have been assigned.
General Usage
Ad Hoc Reporting allows users to create a report referencing the data they are most interested in. Save this report so it can be ran on another day.
Ad Hoc has the following highlighted features
- Accessing Ad Hoc is a permission that can be granted by an Administrator.
- Data Access security as setup in the Administration screen is inheritted
- Ad Hoc reports are yours. The ability to share Ad Hoc reports with other users is currently not available.
Ad Hoc has the following key screen features.
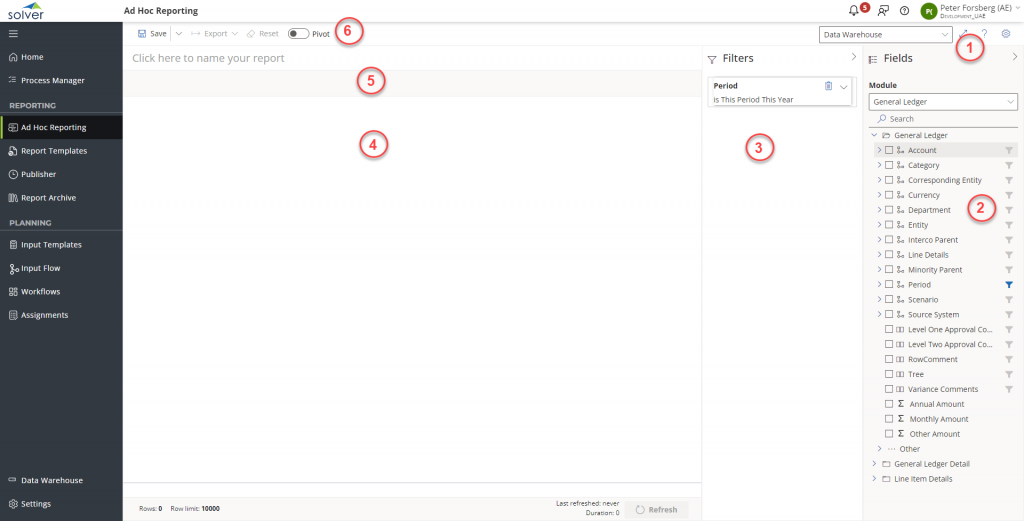
| Number | Feature | Description |
| 1 | Options
|
|
| 2 |
Options
|
For organzations with more than just the General Ledger, click the dropdown arrow to switch to a different module Choose the fields that should appear as columns in your Ad Hoc report by selecting the checkbox icon. Choose the filters of the report by selecting the filter icon. Filters can be defined in the filter grid (3) |
| 3 | Filter Grid |
A list of all fields that have been selected as a filter. By default, for the Period dimension, this year this period is selected. Click this text to display a selector to choose different period options For dimensions, by default all dimension codes will come in. Click the text to display a selector to choose specific dimension values. |
| 4 | Data Grid |
Upon Clicking Refresh (bottom corner of the data grid), your Ad Hoc report will process and once complete, data will appear in this grid. Click a column header to sort |
| 5 | Groupings | Drag column headers from your report into this section to create groupings of data. Typical use cases may include dragging Department into this section to group by Deparment |
| 6 |
Actions
|
|
Using Ad Hoc for the first time or with no saved Ad Hoc reports, users are directed to the Get Started screen. Click on “Get Started” to begin. For customers who have
- Only the Data Warehouse, Ad Hoc will begin loading the interface. This may take a couple seconds to load
- The Data Warehouse and connections made to an on premises ERP system, you will be prompted to select an integration and company
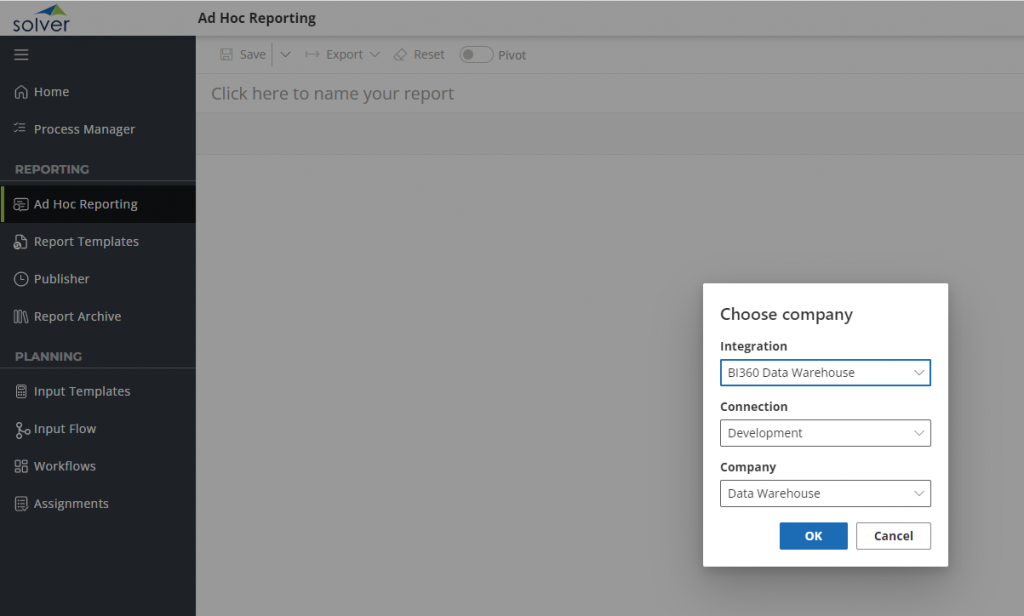
- Click Ok
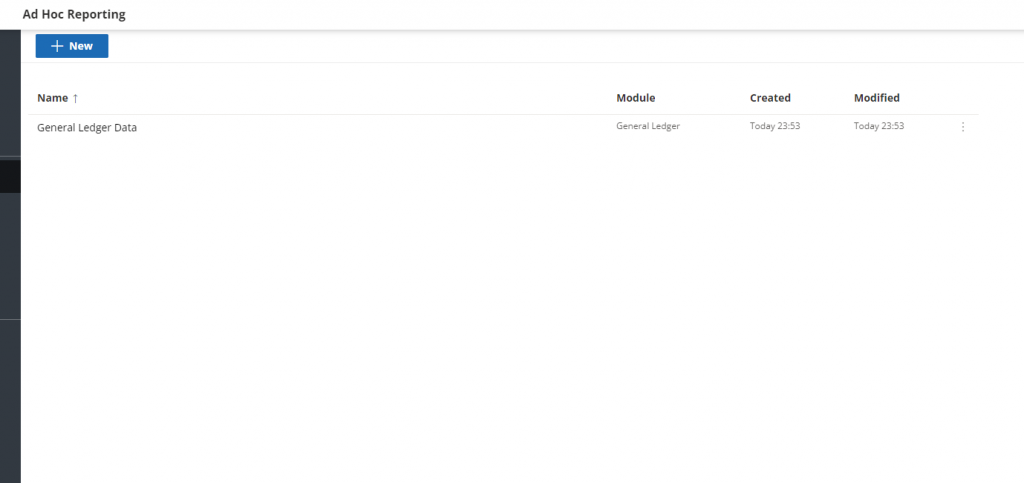
If you have saved any Ad Hoc reports, upon clicking Ad Hoc Reporting, a listing of all previously save reports will appear.
Ad Hoc will load. There are three areas that make up the screen.
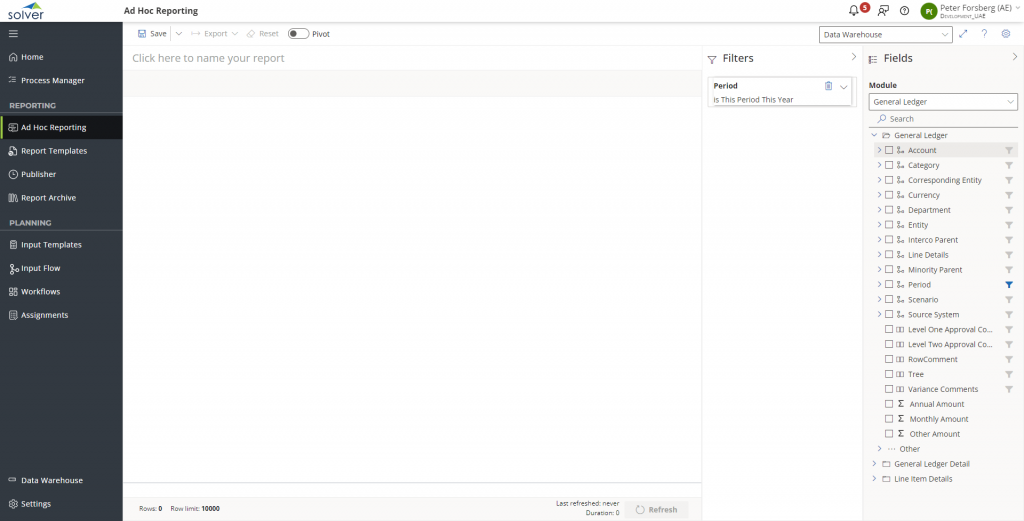
The grid to the far right displays the factsets of the currently selected module.
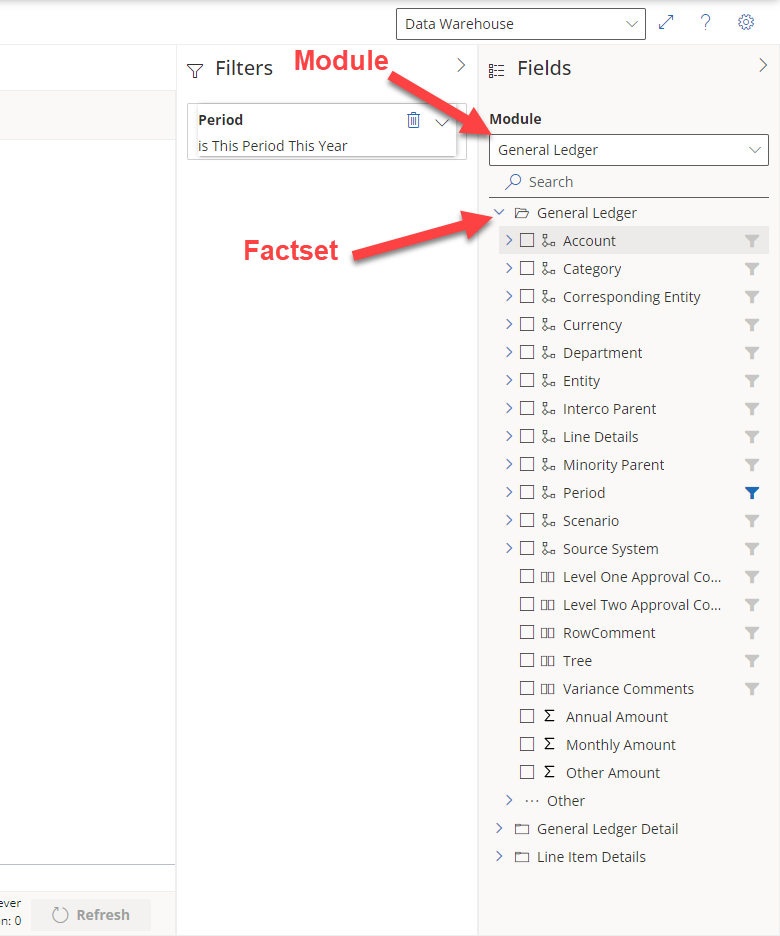
Expand on the factset to display the dimensions you would like to bring into the report.
- Period is a filter by default. Reference the blue filter icon. A default filter for “This peirod this year” has been applied and can bee seen in the middle grid.
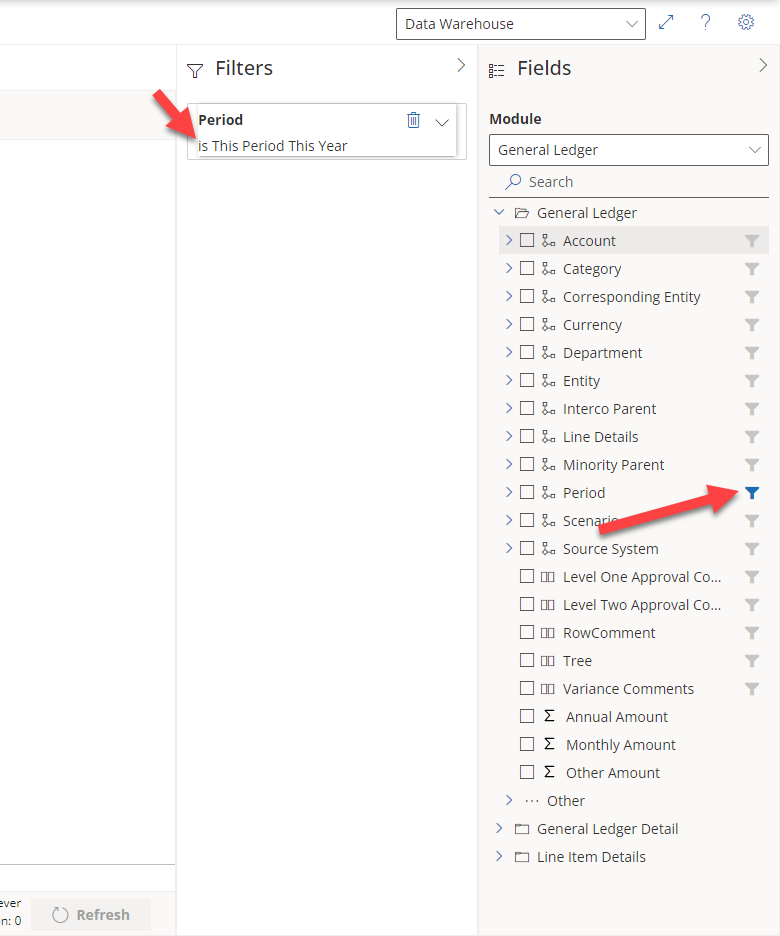
- Period is not a column that will appear in your composer report because the checkbox is not selected. Check the checkbox to make Period appear in your report.
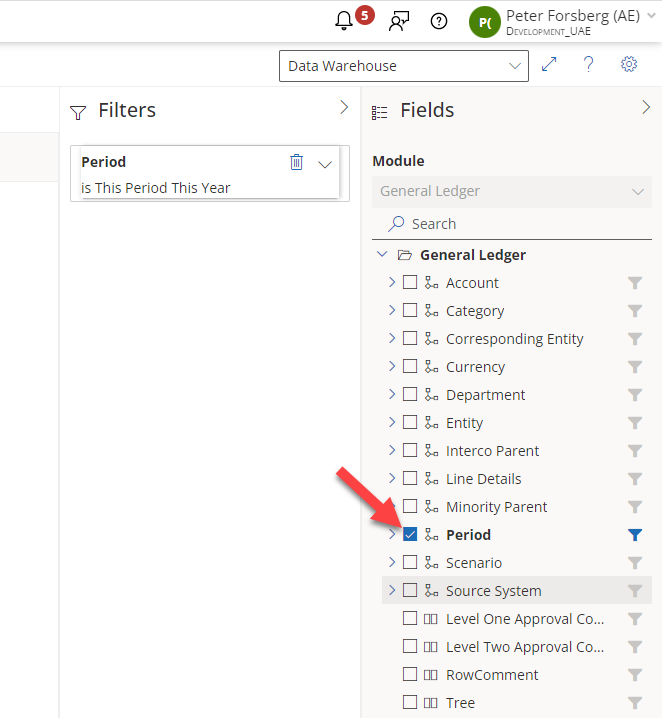
- Clck the checkboxes for other dimensions and attributes you would like to see in your report. Click the filter icon to make it a value you can filter on.
Once all fields are selected click Refresh in the bottom right hand corner of the data grid.
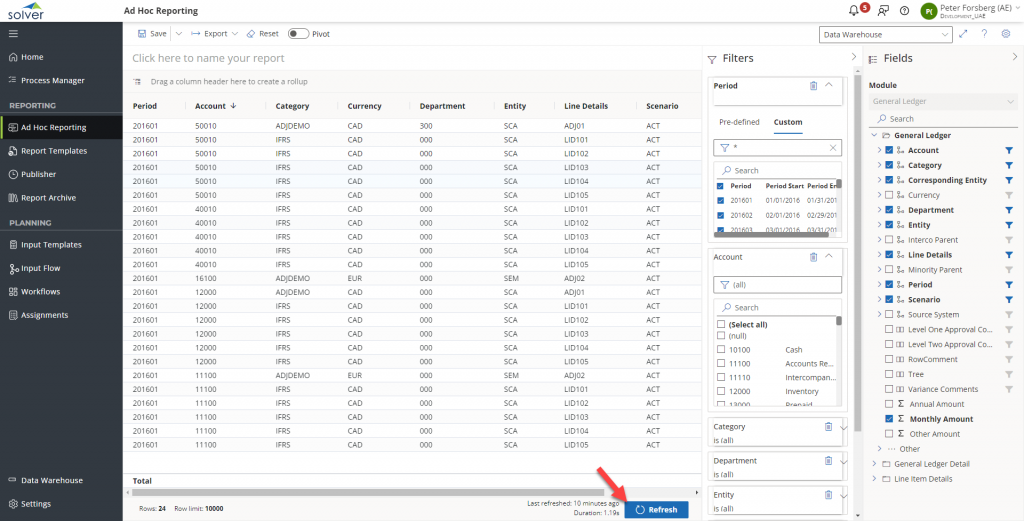
Refresh button becomes active (blue) based off a change being made to the selected fields and/or filters. If it is greyed out, there have been no changes made.
If data does not load or is not what you are expecting, check your filters and make sure the correct filters are applied.